
Taking account of Energy Forecasting
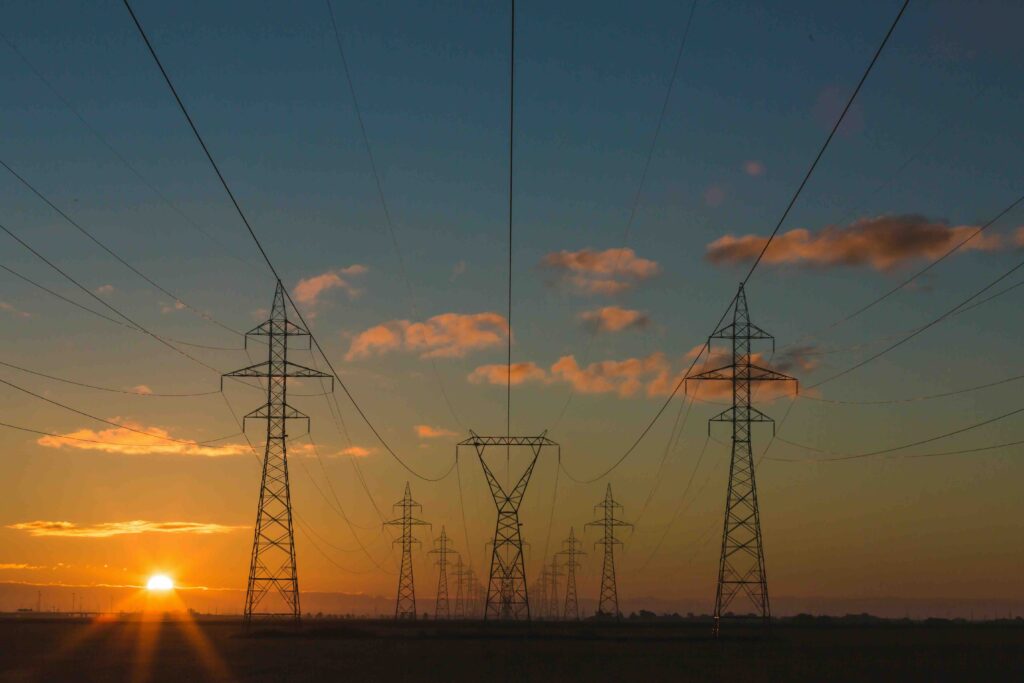
The electricity sector lives in a land of peaks and troughs on both sides of the economic equation – supply and demand. Finding ways to forecast the latter can help manage resources, reduce outages, and improve the bottom line.
So, no surprise that it was standing room only at an event held by the University of Auckland Energy Centre titled ‘Electricity Demand Forecasting 101’ – although admittedly it was held in a small room at the Business School during lunchtime.
Yes Energy (which merged with forecasting company TESLA in 2024) representatives Asaad Mohammad and Henry Chen shared insights into how the company forecasts electricity demand in New Zealand and overseas. The company is based in the US and has clients across the globe.
In NZ, their customers are located across the electricity sector – generators, transmission (Transpower), industrial users, substations, retailers, distributors and power traders.
What’s in a model
There are three ways of modelling electricity demand – Machine Learning, Deep Learning (AI), and hybrid.
Among the advantages of machine learning is that it’s great with structured data, performs well with limited historical data and is easier to interpret. However, it “can struggle with complex sequential/temporal dependencies”.
The deep learning model on the other hand “excels at capturing time series patterns and long-term dependencies” and automatically learns relevant features. But it needs large datasets to be truly effective, and it is less easy to interpret (“black box”).
Data, data, data
Effective modelling depends on data and weather patterns (Yes Energy partners with Metservice) are clearly important for electricity demand forecasting. Other data/variables considered includes:
- day of the week (during weekdays there is higher demand),
- hour of the day,
- seasonality (in NZ there is higher demand in winter, in Australia higher demand in summer),
- long term trends (example being appliances getting more efficient),
- public holidays, and
- economic activity (more power used when a country is doing well).
Sports matches also cause spikes – for example there is a noticeable increase when the All Blacks play, especially during World Cups when matches kick off in the middle of a New Zealand night.
Special pricing deals can also have an impact. Contact Energy’s offer of free power between 9pm and midnight clearly shows up in Transpower’s usage graphs.
The more data, the greater the accuracy and Yes Energy provides its clients with forecasts for the next day through to the next ten years.
Predicting usage in the next decade
There was discussion following the presentation on how climate change and government policies (electric vehicle subsidies etc) might impact forecasting a decade ahead. For example, the energy used by datacentres, which are so essential to AI. This is not currently being tracked in NZ, but Yes Energy is tracking datacentre usage in US, where they are finding the load is constant (that is, no peaks and troughs), and growing.
Tracking electricity usage and comparing it between sectors is itself a fascinating insight into business trends. So too is population behaviour. In Japan, at midday every weekday, electricity demand drops. It’s the time everyone goes to lunch.